
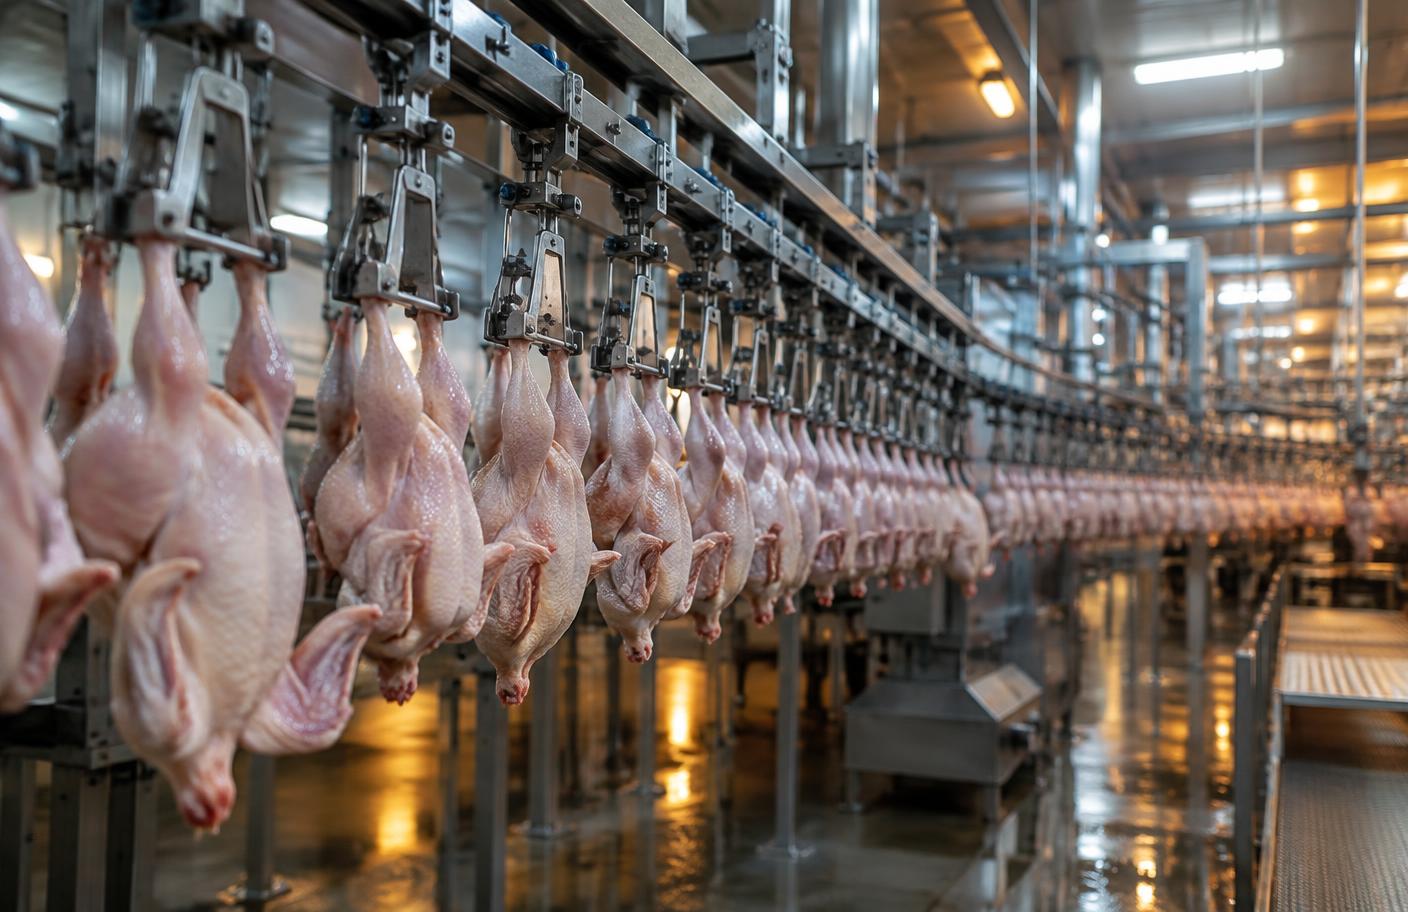
Every broiler farmer sells into the same planetary market, whether the buyer is a processing plant across the highway or a trader filling a container ship. That market is now the largest meat sector on earth: roughly 108 million tonnes of chicken meat a year on the USDA's measure, still compounding at around two to three percent annually, and forecast to keep growing through the end of the decade. Understanding its shape—who produces, who trades, who eats more each year—turns abstract headlines into useful farm decisions.
Field principle
Global numbers do not set your price, but they set the weather your price lives in. Know which way production, trade and feed costs are moving before you commit to a cycle.
How big is the market, and how fast is it growing?
The USDA's Foreign Agricultural Service puts world chicken meat production at about 108 million tonnes for 2025/26, up roughly three percent on the year before, with the ten-year compound growth rate sitting near two percent. Forecasts for 2026 point higher still—toward 110 million tonnes—driven mainly by China and Brazil.
In value terms, analysts estimate the global poultry market in the hundreds of billions of dollars, with volume expected to keep climbing toward 2030. The important point for a grower is not the precise figure but the direction: chicken keeps taking share from other meats because it is the cheapest animal protein to produce, carries few religious or cultural restrictions, and converts feed to meat more efficiently than pork or beef.
Production is concentrated in a few countries
Four producers account for well over half of world output: the United States at roughly a fifth of global production, then China, Brazil and the European Union. Russia, Mexico, Thailand, Turkey, Argentina and Colombia form the next tier, each producing between two and five million tonnes a year.
Concentration matters because it means a disease event, a policy change or a currency swing in one of these countries moves prices everywhere else. When avian influenza restricts American or European exports, importing regions feel it within weeks. When Brazil's currency weakens, its chicken becomes cheaper on every world market it serves.
Trade is even more concentrated than production
Only about one tonne in eight crosses a border, but that trade is dominated by a very small club. Brazil supplies more than a third of world chicken exports, helped by its freedom from highly pathogenic avian influenza in commercial flocks, its cost base and its product range. The United States and the European Union have been losing share, while Thailand has grown to record levels on the back of cooked and further-processed product.
The newest shift is China. Long a quiet trader, China is now exporting aggressively—overtaking Thailand in the USDA's 2026 forecasts—as its production growth outpaces modest gains in domestic consumption. Its niche is low-priced chicken into lower-income markets across Asia and Africa, which puts direct competitive pressure on importers and domestic producers in exactly the regions where demand is growing fastest.
Where the growth in eating is coming from
Per-capita consumption tells two stories. Rich markets are mature: the United States eats around 55 kilograms of chicken per person a year, and growth there is slow. The growth is in developing regions—Asia, Africa, Latin America and the Caribbean—where rising incomes, urbanisation and population growth push people toward the most affordable meat.
The OECD and FAO expect developing countries to account for the large majority of both production and consumption growth this decade. For a farmer in one of those regions, that is the single most encouraging structural fact in the industry: the long-run demand curve points upward, even though prices in any given month can be brutal.
What this means for a single farm
First, your real competition may be a container, not a neighbour. In import-dependent markets, the landed price of Brazilian, American or increasingly Chinese chicken sets a ceiling on what domestic birds can earn. Knowing your country's import volumes and tariff position is as practical as knowing your feed price.
Second, feed is the global variable that reaches every farm. Corn and soybean meal are world commodities, so a drought in the Americas or a shipping disruption shows up in a Caribbean or African feed bill within months. This is why feed price, not feed cost, deserves its own discipline.
Third, disease status is market access. Countries that keep highly pathogenic avian influenza out of commercial flocks keep their export options open; those that do not can lose markets overnight. Farm-level biosecurity is a small part of a national position that is worth real money.
Finally, treat every forecast as a range, not a promise. The figures here come from USDA and OECD-FAO publications, which revise their numbers regularly. Use them to understand direction and scale, then confirm the prices, import rules and demand that actually apply where you sell.